Dashboard KPI Report App Help your decision makers with the Dashboard KPI Report App Run app In order to assess the performance of your company, it is imperative that you possess an overview of your company in terms of numbers. A business that grows is bound to have incremental revenues. Turning your excel data into […]

Alexandra Müller
Management
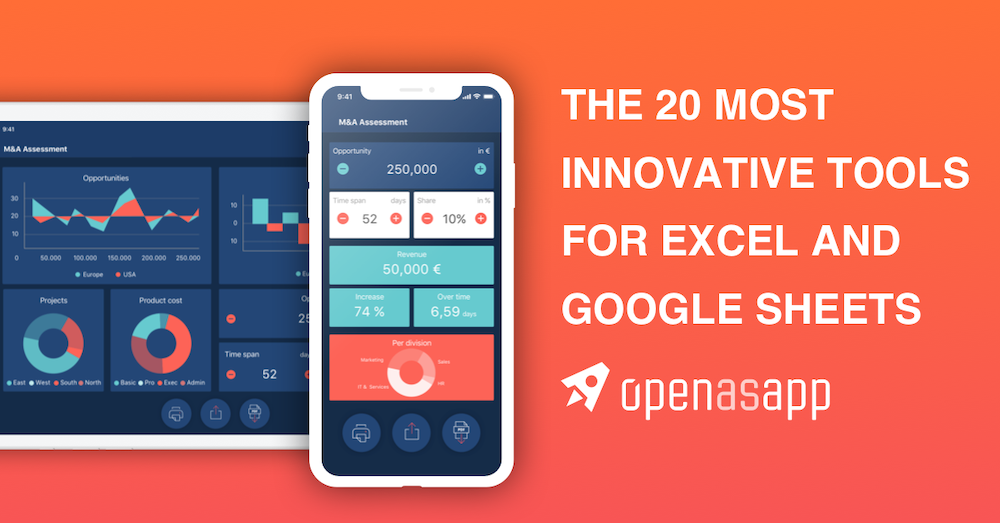
Help your decision makers with the Dashboard KPI Report App


In order to assess the performance of your company, it is imperative that you possess an overview of your company in terms of numbers. A business that grows is bound to have incremental revenues. Turning your excel data into a dashboard KPI report app will help the decision-makers to choose which projects or departments should receive more funding to help the company to grow long-term.
Whether your company does, or does not, make a profit, it is imperial for you to have access to data on each department. With this data, it is easier for your company to optimize future profits by identifying and focusing on successful projects.
KPI reports are an overview of your system at a glance. The dashboard method of reviewing data and the status of ongoing operations provides a significant opportunity to help the decision-makers in your company to be more efficient and faster to respond to issues and opportunities with data-driven decisions.
When your dashboard KPI report app is created directly from your day-to-day excel files and you don’t even need prior knowledge in handling data visualization software, the job doesn’t only get easier for your management team. It also gets easier for you.
All information you enter is confidential and will not be stored by us. Your entries are only visible to you and are not stored in the app. If you want to keep your data, you can create a PDF in the app’s menu under Print or select “Save data” in the menu, set your settings to private and save.
Category
Popular posts


Alexandra Müller

Alexandra Müller

Alexandra Müller


2025 Open as App GmbH